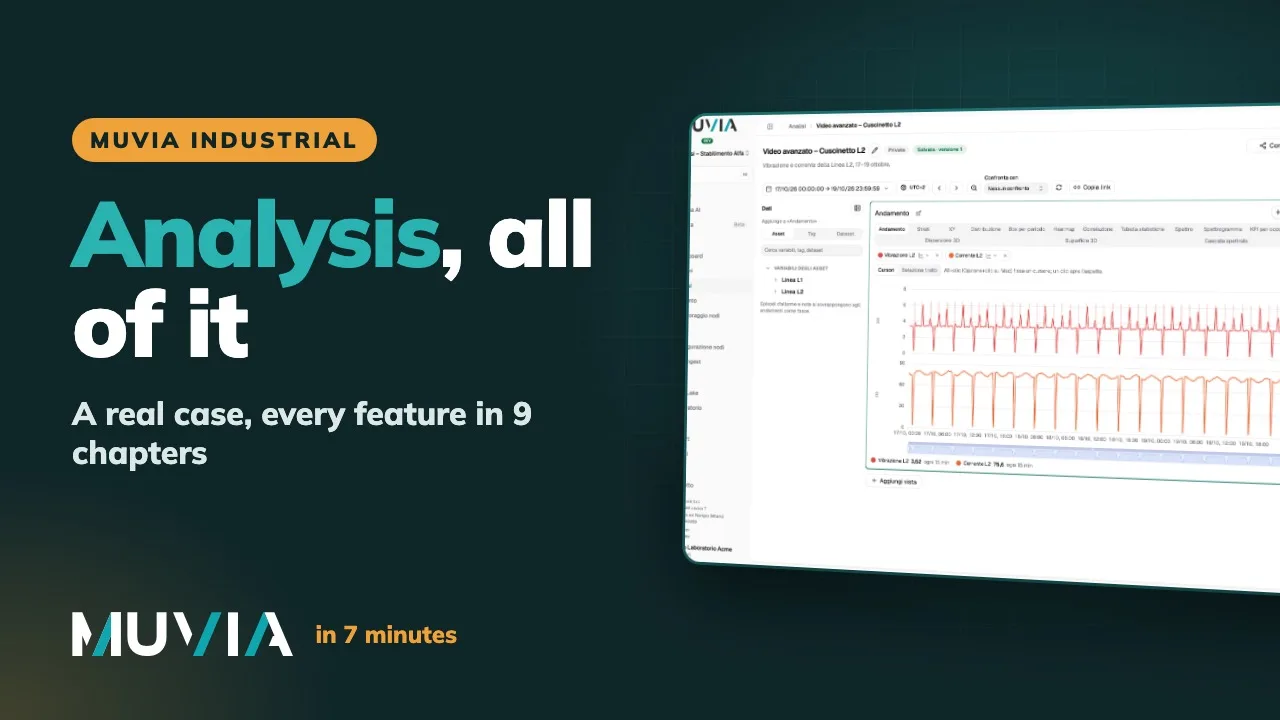
Signals over time, in 3D and in frequency
Analisi puts a node's signals on the same time axis: vibrations, temperatures, currents. Beside it there is an XY chart and a 3D scatter view, to compare quantities of the same machine.
For a signal such as vibration there are also the spectrum and the spectrogram, which show it in frequency. Reference lines can also be diagonal on a time axis.
Conditions, events and cursors
You define a condition, a stop for example, and align several layers on the event to see what came before and after. Cursors give the difference (Δ) between two points and annotations leave a note of what was seen.
Recurring patterns
Pattern ricorrenti is a separate module, under Analisi. Patterns can be searched by example, by sequence, or discovered in the data; for each you see its occurrences and what anticipates them.
With «Segui sui dati nuovi» a pattern keeps being searched for in the data that arrives.
Save, share, start again
An analysis is saved with its versions. A public link opens it up to date without an account, and a dashboard can show it with the «Vista di Analisi» widget. From a series, «Nuova query da qui» prepares a query to continue from.